Reading a footprint chart, from the first cell
Bid, ask, delta, imbalance, absorption: what each number in the candle says, and the three patterns worth learning first.
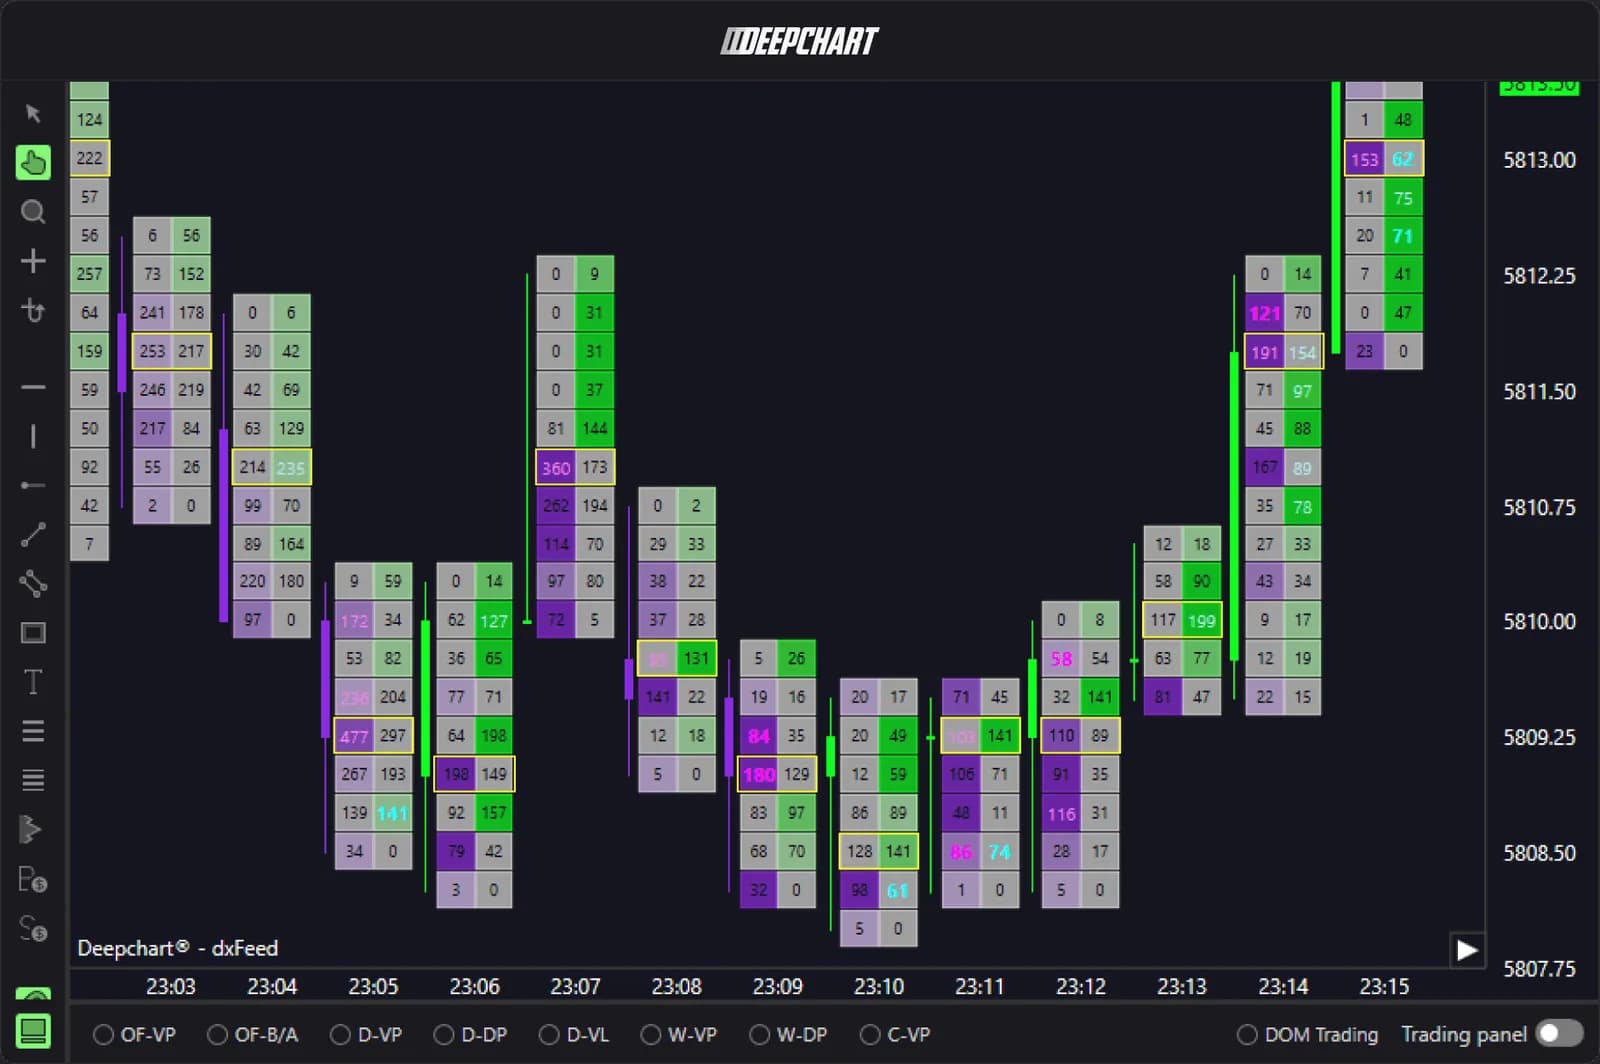
A footprint chart is a candle opened up. Instead of four prices (open, high, low, close), you get every price the bar traded at, and on each one two numbers: what was sold into the bid and what was bought at the ask. Once you can read one cell, you can read the bar. Once you can read the bar, you can see who is in control before the candle closes.
What a cell says
Each row is one price. The left number is volume traded at the bid: sellers hitting resting buy orders. The right number is volume traded at the ask: buyers lifting resting sell orders. 12 × 48 means 12 contracts sold aggressively, 48 bought aggressively at that price.
DeepChartsOFF builds these numbers from the MBO feed, so the aggressor side of each trade is read, not estimated from tick direction.
Three numbers per bar
- Delta: ask volume minus bid volume for the whole bar. Positive delta: buyers were the aggressors. It tells you who was pushing, nothing more.
- Point of control: the price with the most volume in the bar, outlined on most footprints. Price often comes back to test it.
- Imbalance: the ask at one price compared diagonally with the bid one tick below. When one side is several times the other (300 % is a common setting), the cell is highlighted.
The three patterns to learn first
Absorption
Heavy volume on one side at the edge of a move, and price does not progress. Sellers hit the bid over and over at the low, and the low holds: someone passive is absorbing them. It often marks the end of a push, but only once price leaves the level.
Stacked imbalances
Three or more imbalances in a row on the same side. It is initiative activity, with one side moving price through several levels with urgency. Those stacks often act as support or resistance when price comes back.
Finished and unfinished auctions
Look at the extreme of the bar. Zero, or almost nothing, on one side at the high (0 × 23) means buyers stopped finding sellers: the auction finished. Size on both sides at the extreme suggests an unfinished auction that price may revisit.
How to practise without paying for it
Load a past NQ session in the DeepChartsOFF tick replay, slow it down, and call each pattern out loud before the next bar prints. Hours of replay cost nothing. A failed evaluation does.
Firms that run DeepCharts